Today I would talk about one of the most intriguing topics related to data mining tasks: the regression analysis.
As you know the regression analysis is an approach to modeling the relationship between a set of variables "y" and explanatory variables "x" (called regressor).
The model I've chosen to talk about regression is strictly related to the SVM algorithm already presented in our classification problems: Support Vector Regression (SVR).
How does it work?
In SVR the basic idea is to map the data x into a high-dimensional feature space F via a nonlinear mapping and to do linear regression in this space.
Why SVR?
- SVR is extremely robust even in input space having high dimension because the optimization doesn't depend on the dimension of input space.
- SVR depends only on a subset of the training data, because the cost function for building the model ignores any training data close to the model prediction.
- SVR over ordinary linear regression has the advantage of using a large variety of loss functions to suit different noise models.
- SVR is more robust than linear regression for noise distributions close to uniform.
Applications
The regression models are widely used to infer a phenomena through several variables. Financial forecasting, risk management, clinical tests, are just examples of areas where these techniques are applied.
Consider for instance earthquake events: imagine for an insurance company how can be relevant assign a risk score to define the right premium for such risk.
For this kind of market a predictor based on other variables already available or at least on variables easier to predict could represent a solid base to assess the right price for the premium and, the discovery of new predictors could represent a huge advantage respect competitors.
...Let's try to play with SVR:
Experiment: Earthquakes prediction using sunspots as regressor
Early warning: this is just a tutorial, so don't consider the results of this experiment as a real scientific work on earthquake prediction!
Data considered:
- series of earthquakes registered in USA since 1774 to 1989.
- series of sunspots registered since 1774 to 1989.
Let's plot the graph of the number of quakes registered per year and the related number of sunspot:
 |
| The two coplanar axis are respectively the "time line" and "# sunspots", the z axis represents the number of earthquake registered. |
As you can see the graph shows a significant increasing of the number of earthquakes registered when the number of sunspots are dramatically low and high.
What about the magnitude?
 |
| The two coplanar axis are respectively the "time line" and "# sunspots", the z axis represents the highest magnitude of earthquakes registered. |
Support Vector Regression
I removed the time line axis; the below graph shows the number of earthquakes and the respective number of sunspots:
 |
| On X axis # sunspots, on Y axis # earthquakes. (the point have been joined just for the sake of clarity) |
I played a bit with Gaussian kernels, and here you are the results of the SVR regression:
 |
| In Red the original data, in Blue the predicted data. |
As you can see the model is extremely precise especially when the sunspots are greater than 50.
For low values of # sunspots the predictor tends to underestimate the number of earthquakes occurred.
Same considerations in prediction of magnitude:
 |
We will see how to improve the accuracy.
Stay tuned!
cristian
Appendix
Sunspot series:
 |
| Sunspots series |
Earthquake series:
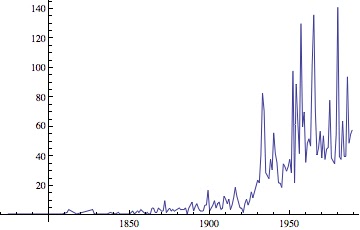 |
| Earthquake series. ... The increasing of number of quakes is suspicious. |

Is this a joke?
ReplyDeleteHi,
DeleteAs I mentioned in the post, it is just an experiment based on real data.
Is this model really able to forecast earthquakes? I don't know... it's unlikely that just a variable can describe a complex event as quakes but looking the results I think that a sort of correlation between the two phenomena is not so far from the reality.
...In the next post, I gonna use the regression function to a recent dataset (1989 to 2012) and we will check how reliable it is!
Stay tuned!
I don't think it's a joke, at all!
DeleteThat stuff is serious! Something like that should have made it into one of the most exhilarating french comedies of all time!
mhmm. I didn't get the meaning of what you said.
DeleteCould you please be less cryptic?
Hi understand that such topic can cause reactions by geologists and expert of quake events. I'm totally open to critics, but I would like once again remark that:
ReplyDelete--> This post is just a tutorial to explain a regression technique.
--> The input data are real but even if the regressor function is able to explain very well (especially with #sunspots input >50) this doesn't mean that it is able to forecast quakes!!
--> In the post there's mention about "warning" on scientific validity of this example (I think that I have been transparent and correct).
With regard to "French comedies": are your concerns (and sarcasm) related to the SVR technique or are related to example used to explain it?
@last anonymous: actually I don't see that the former comment was cryptic: the message has been clearly delivered! :)
Come on guys, is it so difficult to just laugh sometimes?
ReplyDeleteThis blog entry is both hilarious and well explained.
How many times have you seen the so called medias reporting dubious correlations along the lines of "people who drink more milk during childhood have more chance of becoming rich when adults"?
The choice of the data sets is probably intented to make fun of that.
Sometime I love be a bit provocative :) I think be provocative is in the nature of data miner (even if the first skill must be the humbleness).
ReplyDeleteBTW, in the post I sowed some clues.
For instance have a look at the earthquake series in the post's appendix: the graph itself it's really weird, indeed, in the caption I clearly highlighted that the increasing is really suspicious.
-> in the next post I would take this freakpost as an example of what a dataminer should avoid to do!
just as anticipation: the overall error in the analysis doesn't lay in the technique (SVR has been correctly implemented, trained and tested) but in the way I used (fortunately intentionally) and in the dataset used.
So the SVR model overfits the variables (indeed the test explained well the training set but i didn't do tests over a test set never seen before by the model), and dataset itself is not representative of the domain.
...Let's discuss on that in the next post.
cheers.
gümüşhane
ReplyDeletebilecik
erzincan
nevşehir
niğde
V2İ