If your features extractor has been made regardless the context, whatever amazing classification algorithm you gonna use ... the accuracy will be always unsatisfactory.
In the text categorization, you should consider at least the following points:
- document containing a lot of text or in opposite documents containing few words.
- document containing semantic or in opposite documents without explicit semantic (like for example invoices or table)
- context dictionary: that is the set of words used in the domain your are working on (for example words like acronyms having meaning only in a specific context)
- the overall environment where the classifier will work: are there different languages? are there heterogeneous sources? the manual classification is based only on the single document under processing?
- business constraints: like max time to process a document or business process.
Bag Of Words based on TF - (I)DF
Term Frequency - Inverse document Frequency (TD IDF) function is based on a work of Spärck Jones and Karen in 1972. It basically combines local frequency property of a specific word in the document with a global property based on the number (inverse) of documents containing this word. Further technical details are available in internet (let me know if you are interested to the original paper published).
Even if this function is dated, we will show how to is it in smart way to achieve good accuracy.
- When does the TF DF work better than TF IDF?
When the documents of your domain contain few words (e.g. invoices, spreadsheets, bank statements) the global component of IDF doesn't work well. In this context the easier TF DF works better!
In the classification sample we are working on, I gonna use K different Bag of Words (one bag of words for each class) using both methods... we will check what is the best strategy!
To be honest I slightly modified the function in this way
| Modified TF (I)DF function |
- W_i[D_j] = Occurrences for the Word W_i in the document [D_j];
- DF[W_i] = Number of Documents containing the Word W_i
- |TrSet| = Number of Documents for the specific Class;
The Features set has been obtained filtering the documents by the StopWord list and stemming each word considering only the "Base Form".
Here you are The first 20 Features extracted for the Reuters data Set TOPICS = "GOLD" (see the previous post for further details) with the respective weight:
| TF DF | TF IDF | ||||
| say | ,51.907757725859135 | sigma | ,71.5899150352952 | ||
| gold | ,49.86505578380171 | police | ,64.30524039891371 | ||
| ounce | ,22.146187073000476 | model | ,64.30524039891371 | ||
| ton | ,8.317113808183201 | land | ,64.30524039891371 | ||
| mine | ,7.7300297803876585 | grant | ,64.30524039891371 | ||
| company | ,7.112820339974604 | china | ,64.30524039891371 | ||
| pct | ,7.094497045719568 | pope | ,64.30524039891371 | ||
| year | ,5.215953054827821 | rand | ,60.616126176742966 | ||
| ore | ,3.48549104848714 | placer | ,59.847379800543116 | ||
| production | ,3.2688965028783508 | foot | ,59.26642022035086 | ||
| grade | ,3.059411347433722 | say | ,58.04561519245233 | ||
| silver | ,2.5460893593153946 | warrant | ,57.23666647951021 | ||
| price | ,2.205337527517457 | shoji | ,55.38951920217253 | ||
| reserve | ,2.123335553835266 | client | ,55.38951920217253 | ||
| drill | ,2.118861548885319 | ridge | ,55.38951920217253 | ||
| expect | ,2.0390821784153337 | alligator | ,55.38951920217253 | ||
| corp | ,2.0390821784153337 | play | ,55.38951920217253 | ||
| foot | ,2.0236289512856094 | vehicle | ,55.38951920217253 | ||
| short | ,2.0225200886354586 | grand | ,55.38951920217253 | ||
| average | ,1.9028247115440413 | action | ,55.38951920217253 | ||
CLOSENESS CENTRALITY BASED
This is an attempt (I simplified a lot my the original version to highlight the main idea) using the Graph Theory to build a sort of "latent semantic" feature set.
After the filtering and stemming operations, I partitioned the document in couple of contiguous words and I built a direct graph:
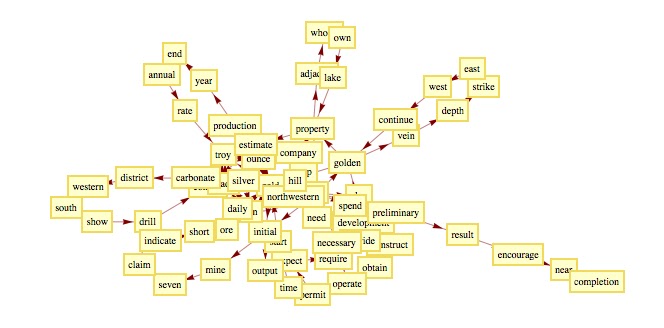 |
| Sample of Direct Graph for a file of the Class "GOLD" |
To assign a score to a feature I used a Closeness Centrality function: The closeness centrality of a vertex u is defined as the inverse of the sum of the distance from u to all other vertices.
Assigning a color to the vertexes of the above graph (warm color for vertex having high score) you obtain:
 |
| Closeness Centrality assignment for the above graph |
The first 20 features extracted using this method are:
| bureau | ,0.02127659574468085 | |
| interior | ,0.01639344262295082 | |
| import | ,0.014705882352941176 | |
| check | ,0.01135161135161135 | |
| revise | ,0.01105263157894737 | |
| technique | ,0.01020408163265306 | |
| period | ,0.00985400705790957 | |
| change | ,0.009708737864077669 | |
| sigma | ,0.009616273693943597 | |
| significant | ,0.009615384615384616 | |
| cabinet | ,0.009345794392523364 | |
| tunnel | ,0.009212305611899932 | |
| affect | ,0.008928571428571428 | |
| viceroy | ,0.008796296296296295 | |
| conservatively | ,0.008284833960972269 | |
| milling | ,0.008240857798379922 | |
| practice | ,0.008149473265752336 | |
| amenable | ,0.008 | |
| cove | ,0.0078125 | |
| department | ,0.00757930926707298 | |
How many Features Have we consider to obtain good accuracy?
How can we analyze the differences among the different Features Set seen before?
We will discuss about that in the next post.
Contact me at cristian.mesiano@gmail.com if you are interested to the Wolfram Mathematica source code.
Stay Tuned!!
hi, you have a small typo in your post: "Spärck Jones and Karen" gives the impression of two people, but Prof Spärck Jones first name was Karen, so there should be no "and" there.
ReplyDeletecheers,
Valeria
You are right!
ReplyDelete...fortunately the link is correct.
Thank Valeria to have noticed that.
Very nice blog ! Good luck !
ReplyDeleteHi, Cristian.
ReplyDeleteVery nice blog, thanks for these examples.
I don't understand how you partitioned the document in couple of contiguous words and how you built a direct graph from those. Can you explain more about this topic? Thank you.
Hi "Anonymous",
ReplyDeletethx for your appreciation!
in this example I created the graph, considering the contiguous words in the doc (after filtering and stemming). Let's consider for instance the following doc:
"the price of the oil is increased by 10% in the last year. the extraction of the crude is lower than expected".
filtered: "price,oil, increase, last, year, extraction, crude, low"
edges: price->oil, oil->increase, increase->last, last->year,year->extraction, extraction->crude, crude->low.
the weight of each edge is equal to the number of occurrences of the same edge in the document.
I hope it answers correctly your question.
It would be great if you join the list of the "followers" of the blog.
cheers
c.
Thank you for your answer. I now understand this part.
ReplyDeleteI've joined the followers list of your site.
I'll always thank you for this beautiful blog :)
ReplyDeletecool, thanks
ReplyDeleteIf I have numerical data in my data then how can I extract features from that data
ReplyDelete
ReplyDeleteData Mining Service Providers
Data Mining Process
sakarya
ReplyDeleteelazığ
sinop
siirt
van
ZWİ6M
görüntülü.show
ReplyDeletewhatsapp ücretli show
FKGRL5
A9706
ReplyDeleteYenimahalle Boya Ustası
Amasya Evden Eve Nakliyat
Antalya Rent A Car
Adana Lojistik
Pancakeswap Güvenilir mi
Ankara Parke Ustası
Çerkezköy Mutfak Dolabı
Erzincan Evden Eve Nakliyat
Bitmex Güvenilir mi
301FC
ReplyDeletebinance referans
7D35D
ReplyDeletegörüntülü sohbet kızlarla
burdur ucretsiz sohbet
görüntülü sohbet yabancı
canlı görüntülü sohbet odaları
urfa rastgele sohbet siteleri
kırıkkale sohbet odaları
bursa ücretsiz sohbet uygulaması
muhabbet sohbet
elazığ telefonda kızlarla sohbet
7EBC1
ReplyDeleteSamsun Telefonda Kadınlarla Sohbet
samsun sesli sohbet sesli chat
sohbet sitesi
adana parasız sohbet
görüntülü canlı sohbet
isparta kadınlarla rastgele sohbet
rastgele sohbet uygulaması
mardin görüntülü sohbet siteleri ücretsiz
sesli sohbet sesli chat
FBB47
ReplyDeleteŞirvan
Şefaatli
Hisarcık
Malkara
Mersin
Güngören
Karlıova
Şiran
Altınyayla
شركة تسليك مجاري بالاحساء Ypz9zMr6dy
ReplyDelete8103E152BD
ReplyDeleteinstagram takipçi satın al
Hay Day Elmas Kodu
Bitcoin En Güvenilir Nereden Alınır
Pubg New State Promosyon Kodu
Kafa Topu Elmas Kodu
Happn Promosyon Kodu
M3u Listesi
Total Football Hediye Kodu
Dude Theft Wars Para Kodu