Saturday, January 5, 2013

Graph Clustering through "prominent vertexes": some clarification

I received many mails about the last post, and most of them asking explanations about the technique I developed.
I have to clarify that:

  1. This method is just a consideration about the role played by some vertexes in a generic (directed) graph.
  2. The results posted in the former graph can be a lot improved (I'm working on it among the several streams that I opened around the concept of entropy graph!).
  3. the approach I'm going to explain in this post is not the same I used in the former because I prefer focus on the main idea respect the optimizations (but exential) aspects.
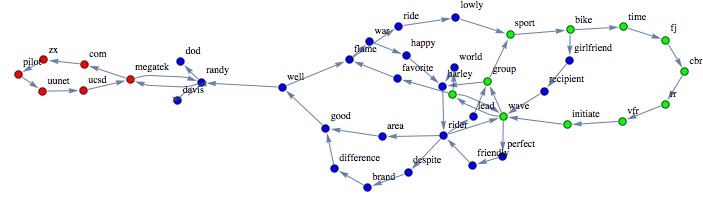
Let's consider the following graph:

Let's consider two nodes: "cbr" and "zx", then let's take all the paths that connect the two nodes:
All the possible paths between the node "cbr" and "zx"
We have now to consider the intersection (excluding the starting and ending points) among the all paths: 
such nodes are essential in order to reach the node "zx" from "cbr"because excluding just one of them, you cannot reach the ending point! 
The prominent nodes for the pair ("cbr","zx"): 

In the above procedure we found out the prominent nodes related to the pair "cbr", "zx".
Of course in order to determine the prominent nodes of the entire graph you have to consider all the pairs of nodes: that's the reason that justify the complexity >Binomial [n,2] of the procedure (n = order of the graph). The complexity doesn't consider the complexity to obtain the paths between the nodes!

The final result can be obtained taking the intersection of all "prominent nodes" for each pairs of nodes!
As you can imagine this is an expensive way to obtain the prominent nodes: I'll provide you an update about improvement on it.
Stay tuned 
cristian


Tuesday, December 18, 2012

Graph clustering: an approach based on "prominent vertexes"

I was doing some experiments on the entropy graph, and I noticed that under some conditions it is a good marker of special vertexes.
I'll try to explain the concept without formulas: that's really challenging because of my English :)
These vertexes play a special role that I decided (arbitrarily) to call "Prominent Vertexes": basically if you remove them, you introduce some disconnections on the graph; the remaining connected components are the clusters that induce the graph partitioning. To be more precise the connected components return just the N-1 clusters, the last cluster is obtained by the complement operation between the original graph and the N-1 clusters.

The intuitive explanation

  • Consider all the possible paths between two nodes A and in a graph
  • Let's take for the above paths the intersection of them.
  • The result is a set of nodes that are essential to connect the two nodes: these nodes are the prominent nodes for the vertexes and B
The above schema can be applied (with some expedient) to all the Binomial[N,2] pairs of vertexes.

Some result
1st example
Let's consider the following graph and the respective "prominent vertexes":
In yellow have been depicted the prominent nodes for the graph
The clusters obtained considering the connected components are the following:
The 3 clusters obtained on the graph
As usual I compared my approach against another technique:  A. Clauset, "Finding Local Community Structure in Networks," Physical Review E, 72, 026132, 2005.
The 6 clusters obtained through the "Clauset" method.
Comment:
As you can see the proposed approach seems to be much less fragmented respect the Clauset method.

2nd example
Here is another example:
The 2 clusters obtained with the prominent vertexes method,
The 6 clusters obtained through the Clauset method.
Comment:
As in the former example the "prominent vertexes" method seems to behave better (even if the result is not optimal).

Considerations

PRO
  • The method proposed seems to be a promising graph clustering algorithm.
  • The method doesn't require parameters (e.g. number of clusters).
  • The method doesn't fragment to much the nodes. 
CONS
  • The complexity is (for the current implementation) quite high ~Binomial[Graph Order, 2].
  • The method requires improvements and theoretical explanation.
  • The method has lower accuracy when the vertexes degree is very small.
The code will be released as soon as the formalization of the Entropy Graph is completed.
Looking forward to receive your comments.
Stay tuned & Merry Christmas!

c. 

Wednesday, November 14, 2012

Document Clustering and Graph Clustering: graph entropy as linkage function

Let's continue our discussion about the applications of the graph entropy concept.
Today I'm going to show how we can re-use the same concept on the document clustering.
What I want to highlight is that through such methodology it's possible to:

  1. extract from a document the relevant words (as discussed here);
  2. clustering of the words of a document (as discussed here);
  3. clustering set of documents;
  4. clustering a graph and assign a ranking score to each cluster by homogeneity criteria;
The Experiment
For this experiment I chose a subset of the standard dataset called "the 20 Newsgroup dataset".
The documents of this data set are email selected from different newsgroups.
I selected some documents from the categories: Hockey, Motorcycle, Atheist and Electronics.
You can download here the documents used for this experiment.

The procedure 
  • For each document build the respective graph (filtering by stopwords list, and stemming the words). 
  • For each graph calculate the entropy graph value of each vertex (word).
  • For each graph extract the first k relevant vertex (sorting by entropy graph value)
  • Perform hierarchical clustering (in this case I used once again an approach based on Simulated annealing).
The results
Here you are the early results obtained through the clustering.
Each line depicts a cluster (the elements are the filename). The clusters have been sorted by homogeneity criteria assigned by the clustering algorithm. 
Considerations
The results are promising but not perfect. The accuracy achieved is
  •  75.0% for first cluster 
  • 62.5% for second cluster
  • 50.0 % for the fifth cluster
  • 37.5 % for the third and fourth cluster
The reasons of the bad aggregations are related to the class "atheist". Such class contains documents characterized by high variety: documents very short, text not strictly pertinent to the topic, topic quite general.
Moreover the clustering algorithm hasn't been optimized/customize for such problem.
Let's try to analyze the results under a different perspective:

Something more...
I mentioned before that such approach works over the concept of  entropy graph.
Here you are the graph representation of the words related to each cluster.
For each cluster I selected the first relevant 150 words.
In Red has been highlighted the first cluster

In dark Blue Has been Highlighted the second cluster

In Yellow has been depicted the third cluster

In Green has been depicted the fourth cluster.
In Brown has been depicted the fifth cluster.
Notes
Such representation of the clustering highlights that the linkage function used in this experiment depicts quite well the different areas of the graph.
  • The Red cluster grouped together the right block of vertexes.
  • The Brown cluster grouped the right side of the graph
  • The Blue cluster focused on the core of the graph
  • The yellow cluster grouped together the corona of the core of the graph
  • The green cluster grouped together the corona of the peripheral of the graph.
The next steps
In the next post I'll try to refine the results, optimizing the clustering algorithm, and trying to use different kind of clustering algos.
Stay Tuned
cristian

Tuesday, October 23, 2012

Key words through graph entropy Hierarchical clustering

In the last post I showed how to extract key words from a text through a principle called graph entropy.
Today I'm going to show another application of the graph entropy in order to extract clusters of key words.
Why
The key words of a document depict the main topic of the content, but if the document is big, often, there are many different sub topics related to the main.
In this perspective, a clusters of keywords should make easier for the reader the identification of the key points of a document.
Moreover, imagine to implement a search engine based on clusters of relevant words instead of the common indexing of atomic words: it enables documents comparison, taxonomies definition, and much more!
How
The definition of graph entropy I'm studying on, assigns to each word of the document a relevance score and a sub graph of words topologically closed to it.
The clustering should maximize the relevance score obtained merging two words in the same cluster.
It's easy to understand that we have to face a combinatoric maximization problem.
The idea is to take advantage of the Simulated annealing (a bit revisited and adapted to the scope) in order to identify sub-optimal merging solution at each step of the merging phase of the hierarchical clustering.
Experiment
I decided to adopt as document test the complete version of the file we used in the last post: Nuclear_weapon.
Here you are the clusters of first 100 relevant words extracted:
The three clusters obtained.

It's interesting highlight the following considerations:

  • The first cluster merged together words as "material,uranium, plutonium, isotope" and "war, attack, arm", and also "proliferation, movement, control, development".
  • The second cluster (which has the lowest rank) aggregates words as "japan, japanese, place, israel, iraq,american", and "ton, tnt, yeld"  
  • The third cluster (which has the highest rank) describes quite well the primary topic, merging all the most important words of the document! 

Of course, the procedure is still in "incubator" phase, and the accuracy of the clusters rests on the performance of the Annealing clustering (...maybe different algorithms in this context perform better... but just to show a rough solution I guess it's enough :D)
This is the optimization process for the last merging stage (I presume that temperature schedule requires an adjustment):
Optimization curve through Simulated Annealing Hierarchical Clustering (last merging stage)

Next steps:
Looking forward to receive comments, and suggestions.
...It would be interesting using such methodology to create a new kind of full text search engine, totally independent by frequency of the words and frequency of visits.


The doc
here you are the document parsed and colored through the clustering assignment (have been highlighted just the first 100 relevant features ranked through the Graph Entropy method).

http://www.ziddu.com/download/20701582/nuclearWeapons.pdf.html
Stay tuned
cristian.

Monday, September 24, 2012

Graph Entropy to extract relevant words

I would share with you some early results about a research I'm doing in the field of "graph entropy" applied to text mining problem.

There are many definitions of graph entropy, my favorite is very well described in the work of J.Körner: Coding of an information source having ambiguous alphabet and the entropy of graphs (1973).

Why Graph Entropy is so important?
Based on the main concept of entropy the following assumptions are true:

  • The entropy of a graph should be a functional of the stability of the structure (so that it depicts in some way the distribution of the edges of the graph).
  • Sub sets of vertexes quite isolated from the rest of the graph are characterized by a high stability (low entropy).
  • It's quite easy use the entropy as a measure for graph clustering.
As you can imagine a smart definition of graph entropy can be helpful in many problems related to text mining.

Let's see an application of graph entropy to extract relevant words in a document.

The experiment as been done using the first section of the definition of "nuclear weapons".

Results
Graph Entropy:
In red have been highlighted the relevant words extracted through Graph Entropy
Here you are the words extracted (first 25th) - In red I depicted words that in my opinion shouldn't be selected:
weapon, reaction, nuclear release, consider, acknowledge, explosive, weaponsa, detonate, test, ton, bomb, energy, tnt, first, possess, small, device, unite, hiroshima, chronologically, thermonuclear, force, nagasaki

Frequency based:
In red have been highlighted the relevant words extracted through Frequency relevance.
Words extracted through the frequency relevance: 
nuclear, weapon, bomb, fission, test, possess, bombing, detonate, state, unite, tnt, ton, first, energy, release, acknowledge, weaponsa, status, japan, nagasaki, hiroshima, japanese, name, code, type

Closeness Centrality:
In red have been highlighted the relevant words extracted through Closeness Centrality method.

Words extracted through the frequency relevance: 
nuclear, weapon, detonate, possess, nagasaki, first, thermonuclear, small, force, estimatedebut, fabricate, succeed, radiation, tnt, acknowledge, consider, believe, hiroshima, know, nation, boy, explode, matte, date.

Considerations:

  • The method based on graph entropy seems provide the more accurate results (5 errors respect 9 and 11 of the other methods).
  • The graph entropy depicts better the core of the graph containing the relevant words.
  • I tried to expand the number of relevant features and the accuracy of the other two methods tends to worsen quickly:

  • First 40 relevant words using Graph Entropy, Frequency method and Closeness Centrality.
    Notice how the graph Entropy preserves better the core of the graph respect the other two methods.

    Stay tuned
    cristian

    Sunday, August 12, 2012

    Function minimization: Simulated Annealing led by variance criteria vs Nelder Mead

    Most of the datamining problems can be reduced as a minimization/maximization problem.
    Whenever you are looking for the best trade off between costs and benefits you are solving a minimization problem.
    Often the number of the variables that affects the cost function is high and the domain of these variables is in a dense set and, last but not least: in the real world problem often, you have no clue about the analytical form of the function.
    Formally such problems belong to the multidimensional unconstrained optimization family.
    Examples
    Let's consider  easy scenarios where the function cost is conditionated just by two parameters.
    Schaffer f6 function: in the contour plot  dark purple to depict local minimums.


    Another function where minimum ischaracterized by two valleys 

    This function presents several local minimums well depicted in the contour plot

    This function is characterized by a several local minimums having high range of values 

    As you can see the above problems have in common a massive presence of local minimum :).
    Let's see how to handle these problems through an approach that I define hybrid, that is, obtained mixing different methods and properties.
    Simulated Annealing (SA) "variance based" approach
    Disclaimer: I had no the time to check whether this method has been already published somewhere. The underlying idea is quite simple, so I would assume that someone has already spent time in proofing convergence and better variations (and actually I don't think is a rocket science proof it).
    SA, belongs to the family of numerical method based on "search strategy" and its convergence requirements are related to the stationary conditions inducted by the underlying markovian process.
    In a former post I showed an its application in a discrete domain, where at each iteration we chose the next candidate solution by comparison with the current solution. The new solution was found "fishing randomly" a candidate in a discrete space.
    In the above problems the solution space is continuos, so we need a smart strategy to extract the new candidate. Let's see my approach!
    Variance trick 
    Let's consider a sampling in two different region of a function f :
    • sampling_1 in a region having a smooth minimum and evaluate such points
    • sampling_2 in a region having a spiky minimum and evaluate such points
    Take now the variance of these evaluated sets.
    How does the variance of f(sampling_1)  change respect the variance of f(sampling_2)?  
    Here you are the answer:
    As you can see the variance can be used as indicator of a minimum region of the cost function.
    Instead of explore randomly the solution space, the approach I propose is led by the variance used as  above. 
    What happens if the smooth valley is a global minimum?
    There are two intuitive factors to avoid that the algorithm jams in a local minimum:
    1. The acceptance law admit also pejorative solutions.
    2. The sampling procedure moderate by variance (if the variance is chosen high enough) allows explorations of better regions.

    The algorithm

    The meta code of the Simulated Annealing based on variance criteria
    Many optimizations can be done to the algorithm.
    For instance we could condition the annealing procedure only if the
    argMin(evaluate(f,newSet)) > argMin(evaluate(f,curset))

    Tests
    Let's see how the approach works.
    As usual, all my experiments are compared with other techniques. In this case I chose as comparative method the well known "Nelder Mead" method.
    I tried to optimize the Nelder Mead method playing around its param setting: shrink ratio, contraction ratio and reflection ratio.
    All experiments have been done using the same initial points.
    For the Nelder Mead method I plotted just the unique solutions found.
    The approach I propose has been led using always the same setting (3000 cycles, variance sampling = 0.75).
    Experiment 1.
    On the left side it has been represented the solution found by Nelder Mead method.
    On the right side the solution found by the SA presented in this post: the blue point depicts the starting point and the red point depicts the solution found.
    The last chart shows the space solution explored.
    Notice that method found a better solution respect Nelder Mead approach. 

    Experiment 2
    On the left side it has been represented the solution found by Nelder Mead method.
    On the right side the solution found by the SA presented in this post: the blue point depicts the starting point and the red point depicts the solution found.
    SA found a better solution in really few steps.

    Experiment 3
    On the left side it has been represented the solution found by Nelder Mead method.
    On the right side the solution found by the SA presented in this post: the blue point depicts the starting point and the red point depicts the solution found.
    This experiment shows once again the good performance of this approach even if the problem is very challenging!

    Experiment 4
    On the left side it has been represented the solution found by Nelder Mead method.
    On the right side the solution found by the SA presented in this post: the blue point depicts the starting point and the red point depicts the solution found.
    The convergence, as shown above, has been reached very quickly.

    Conclusion
    The approach seems promising and works well in different contexts:  I'm quite sure that many improvements can be implemented.
    I'm looking forward to receive your comments, ideas and other comparative tests.

    Stay tuned!

    cristian

    Tuesday, July 10, 2012

    Data Mining: Tools and Certificates

    As member of many Linkedin groups related to data mining & text mining I read many threads related to certificates that should help either in job seeking and consolidating curriculum, and many other threads about miraculous tools able to solve whatever problem.
    Is being certified really worth it?
    In my experience I think that a certificate in a specific data mining tool could be a positive point on the curriculum, but it doesn't really help to improve your knowledge on the field.
    Let me explain better (which is not easy with my bad English): The certificates system is a market and its target is to generate profit or to promote products.

    Data mining tools
    My question is: do you really think that can exist a tool able to embrace all aspects related to data mining?

    I guess that the number of problems data mining related are so high that maybe we could use the Cantor diagunalization to proof that are uncountable :)


    In my opinion is too naive the common thought that through a software, clicking here and there you can obtain tangible benefits in mining your data.
    The "data mining" definition has been created by marketing industries just to summarize in a buzz word  technics of applied statistics and applied mathematics to the data stored in your hard disk.
    I don't want say that tools are useless, but it should be clear that tools are only a mean to solve a problem, not the solution.
    • In the real world the problems are never standard and really seldom you can take an algorithm as is to solve them! ...maybe I'm unlucky but I never solved a real problem through a standard method.
    • The tool X is able to load Terabyte of data. And so what? A good data miner should know that you cannot consider the entire population to analyze a phenomena, you should be able to sample your population in order to ensure the required margin of accuracy! ... this technic is simply called Statistic!
    • If you really want to claim "I know very well this approach", you must be able to implement it by your self: only implementing it by your self you can deeply understand in which context the algorithm works, under which conditions it performs better than other tools and so on. Don't rely only on one paper that compare few techniques: if you change just one of the conditions the results are terrible different.
    • Without theory you cannot go deep: Let's consider a tool as Mathematica or R or ... These tools allow the user to have access to a large library of pre defined algorithms and routine, they provide visualization functions to show results in a fancy way, and last but not least they provide a complete language programming to code whatever you want. I love them, but I couldn't do anything without the theory behind the problem. Mathematica can provide me the algorithm to cluster a data set through k-means: but how can I be sure that it is the right algo for your problem? (click here to have a demo).
    Actually I would prefer attend a course to deepen some aspects of multivariate statistic or seminars on new methodology to solve some problem respect pay plenty money to know every single detail of a tool, that maybe will not be in the market in the next 5 years.

    I know that the companies often are looking for certified guys on a famous tool just because they bought it and they need to reduce the time to "integrate" a new resource on a team. Fair enough! ...but I think it is ridiculous require certificates as strict requirement!
    I'm really curious to know your experiences and opinions.
    cristian