Showing posts with label SVR. Show all posts

Wednesday, April 4, 2012

Earthquake prediction through sunspots part II: common Data mining mistakes!

While I was writing the last post I was wondering how long before my followers notice the mistakes I introduced in the experiments.
Let's start the treasure hunt!
1. Don't always trust your data: often they are not homogeneous.
In the post I put in relation the quakes in the range time between [~1800,1999] with the respective sunspots distribution.

A good data miner must always check his dataset! you should always ask to yourself whether the data have been produced in a congruent way.
Consider our example: the right question before further analysis should be: "had the quakes magnitude been measured with the same kind of technology along the time?"
I would assume that is dramatically false, but how can check if our data have been produced in a different way along the time?
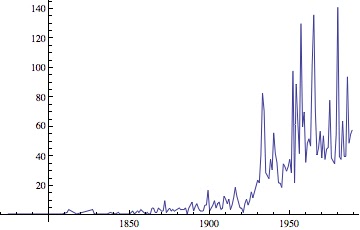
In this case I thought that in the past, the technology wasn't enough accurate to measure feeble quakes, so I gathered the quakes by year and by the smallest magnitude: as you can see, it is crystal clear that the data collected before 1965 have been registered in different way respect the next period.
The picture highlights that just major quakes (with magnitude > 6.5) have been registered before 1965.
This is the reason of the outward increasing of quakes!
... In the former post I left a clue in the caption of "quakes distribution" graph :)
In this case the best way to clean up the dataset is to filter just quakes having magnitude grater than 6.5.
Let me show you a different way to display the filtered data: "the bubble chart".
The size of the bubble is representative of the magnitude of the quakes 

The size of the bubble is representative of the number of the quakes
I love the bubble chart because it is really a nice way to plot 3D data in 2D!!

2. Sampling the data: are you sampling correctly your data?
In the former post I considered only the quakes registered in USA. 
Is it representative of the experiment we are doing?
The sunspots should have effects on the entire Earth's surface, so this phenomena should produce the same effects in every place.
...But as everybody knows: there are regions much more exposed to quakes respect other areas where the likelihood to have a quake is very low.
So the right way to put in relation the two phenomena is to consider the World distribution of the quakes.

3. Don't rely on the good results on Training Set.
This is maybe the worst joke I played in the post :) I showed you very good results obtained with the support regression model.
...Unfortunately I used the entire data set as training set, and I didn't check the model over a new data set!
This kind of mistake in the real scenario, often generates false expectation on your customer.
The trained model I proposed seemed very helpful to explain the data set, but as expected it is not able to predict well :(.
How can you avoid the overfitting problem? The solution of this problem is not so trivial, but in principle, I think that cross validations techniques are a safe way to mitigate such problem.
Here you are the new model:
The left graph shows the Training Set (in Blue the number of quakes per year, in Red the forecasting model).
The graph on the right side shows the behavior of the forecasting model over a temporal range never seen before by the system. The mean error is +/-17 quakes per year.

The Magnitude forecasting
(on the left the training set, on the right side the behavior of the forecasting model over the test set).
The mean error is around +/-1.5 degrees.
Considering the complexity of the problem I think that the regressor found works pretty good.

Just to have a better feeling of how the regressor is good, I smoothed the data through a median filter:
Moving Median Filtering applied to the Magnitude regressor.
Looking at the above graph, it seems that the regressor is able to follow the overall behavior.
As you can see such filtering returns a better understanding of the "goodness" of your models when the function is quite complex.

4. You found out a good regressor, so the phenomena has been explained: FALSE.
You could find whatever "link" between totally independent phenomena ... but this link is just a relation between input/output. nothing more, nothing less.
As you know this is not the place for theorems, but let me give you a sort of empirical rule:
"The dependency among variables is inverse proportional to the complexity of the regressor".

As usual stay tuned.
Cristian

Wednesday, March 7, 2012

Support Vector Regression (SVR): predict earthquakes through sunspots

In the last months we discussed a lot about text mining algorithms, I would like for a while focus on data mining aspects.
Today I would talk about one of the most intriguing topics related to data mining tasks: the regression  analysis.
As you know the regression analysis is an approach to modeling the relationship between a set of variables "y" and  explanatory variables "x" (called regressor).
The model I've chosen to talk about regression is strictly related to the SVM algorithm already presented in our classification problems: Support Vector Regression (SVR).


How does it work?
In SVR the basic idea is to map the data x into a high-dimensional feature space F via a nonlinear mapping  and to do linear regression in this space.


Why SVR?

  • SVR is extremely robust even in input space having high dimension because the optimization doesn't depend on the dimension of input space.
  • SVR depends only on a subset of the training data, because the cost function for building the model ignores any training data close to the model prediction.
  • SVR over ordinary linear regression has the advantage  of using a large variety of loss functions to suit different noise models.
  • SVR is more robust than linear regression for noise distributions close to uniform.
I don't want spend words about the theory, there are several tutorials on it downloadable from scholar google.

Applications
The regression models are widely used to infer a phenomena through several variables. Financial forecasting, risk management, clinical tests,  are just examples of areas where these techniques are applied.

Consider for instance earthquake events: imagine for an insurance company how can be relevant assign a risk score to define the right premium for such risk.
For this kind of market a predictor based on other variables already available or at least on variables easier to predict could represent a solid base to assess the right price for the premium and, the discovery of new predictors could represent a huge advantage respect competitors.
...Let's try to play with SVR:

Experiment: Earthquakes prediction using sunspots as regressor
Early warning: this is just a tutorial, so don't consider the results of this experiment as a real scientific work on earthquake prediction!

Data considered:
- series of earthquakes registered in USA since 1774 to 1989.
- series of sunspots registered since 1774 to 1989.

Let's plot the graph of the number of quakes registered per year and the related number of sunspot:
The two coplanar axis are respectively the "time line" and "# sunspots", the z axis represents the number of earthquake registered.    
As you can see the graph shows a significant increasing of the number of earthquakes registered when the number of sunspots are dramatically low and high.
What about the magnitude? 
The two coplanar axis are respectively the "time line" and "# sunspots", the z axis represents the highest magnitude of earthquakes registered. 

The above graph returns exactly the same information: to low number of sunspots or high number of sunspots corresponds to higher magnitude of earthquakes.
Support Vector Regression

I removed the time line axis; the below graph shows the number of earthquakes and the respective number of sunspots:
On X axis # sunspots, on Y axis # earthquakes.
(the point have been joined just for the sake of clarity)
I played a bit with Gaussian kernels, and here you are the results of the SVR regression:
In Red the original data, in Blue the predicted data. 

As you can see the model is extremely precise especially when the sunspots are greater than 50.
For low values of # sunspots the predictor tends to underestimate the number of earthquakes occurred.

Same considerations in prediction of magnitude:


We will see how to improve the accuracy.
Stay tuned!
cristian 

Appendix
Sunspot series:
Sunspots series
Earthquake series:
Earthquake series.
... The increasing of number of quakes is suspicious.  
The regressor found: